Vladimir Krivosheev
f817aa38b4
Vladimir Krivosheev
f817aa38b4
RDCT test framework uses Java debugger implementation classes from host/backend-side helpers, so the JPS test dependency must stay on the compile classpath.

Do not generate that dependency into the shared RDCT test plugin descriptor loaded by JetBrains Client. The backend-only Java debugger module is not resolvable in frontend mode and excludes the RDCT test plugin chain during startup.

IJ-MR-184958 IJ-MR-184993 IJ-MR-179029 IJ-MR-184126 IJ-MR-181153 IJ-MR-146078 IJ-MR-175479 IJ-MR-186058 IJ-MR-193195 IJ-MR-196957 IJ-MR-199124 IJ-MR-197441 IJ-MR-204135 IJ-MR-204674 IJ-MR-205883

GitOrigin-RevId: 7ff5463cd43d6b6c4cc6b9363370def9d4c68dcf
stream-debugger-plugin
In some ways, Stream API is better than traditional loop approach: it takes full advantage of modern multi-core architectures, and lets you process data in a declarative way. What's also good is that this approach helps to avoid the state issues, and the code written in it looks more elegant. But, there's a certain downside to it: the code sometimes is sure hard to read, understand, and, of course, to debug.
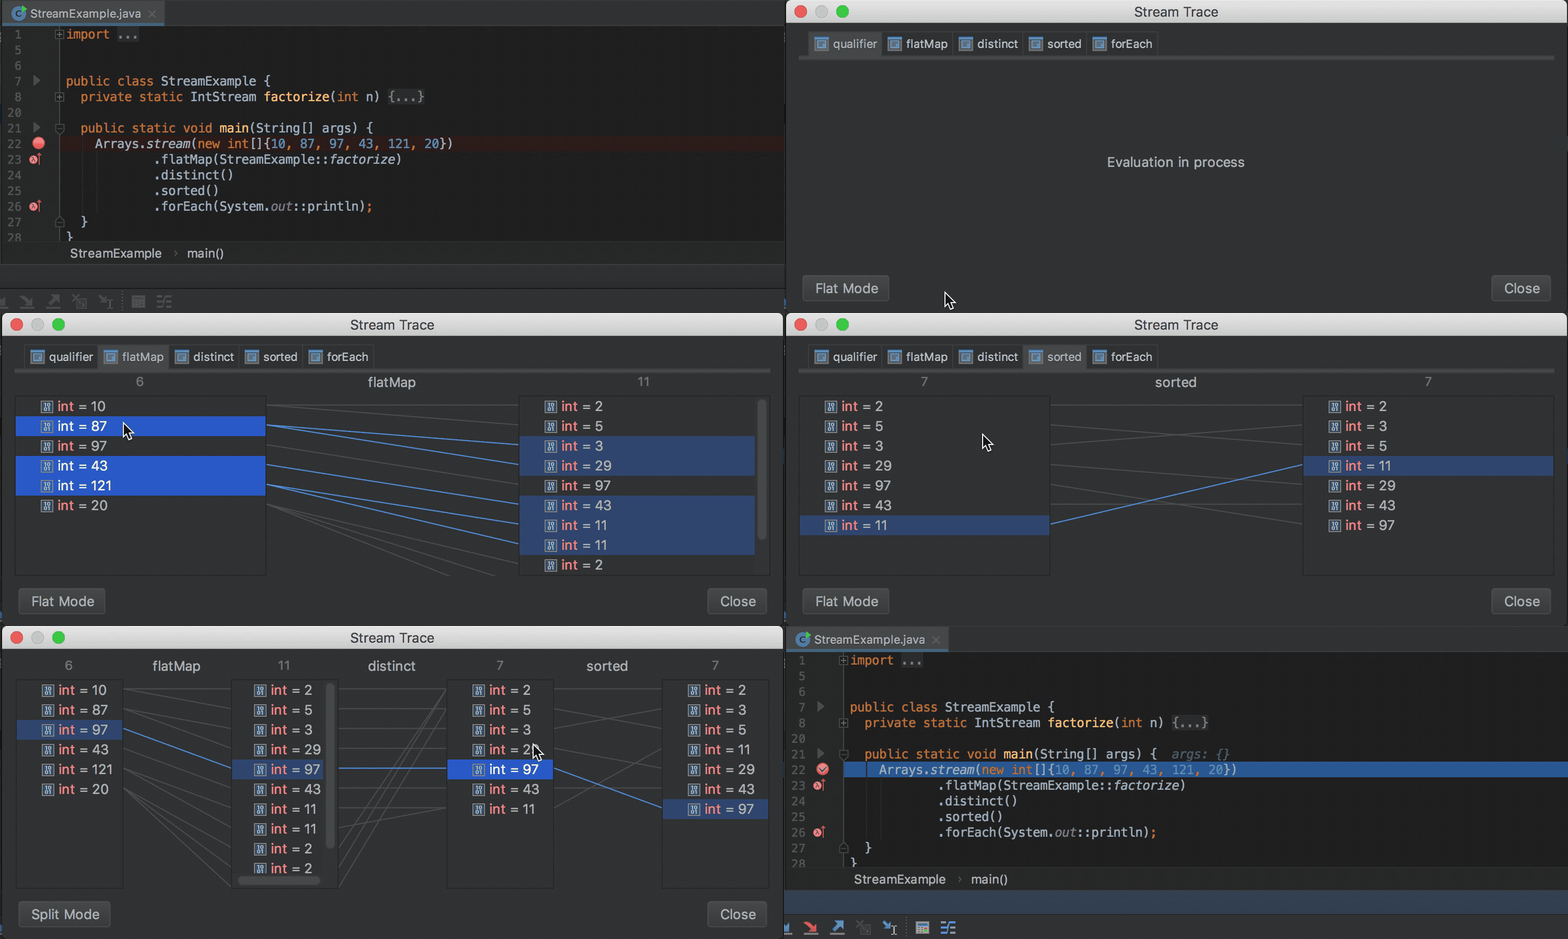
This plugin is here to amend that and offer solutions to the issues you might run into. It extends the Debugger tool window by adding the Trace Current Stream Chain button, which becomes active when debugger stops inside of a chain of Stream API calls.
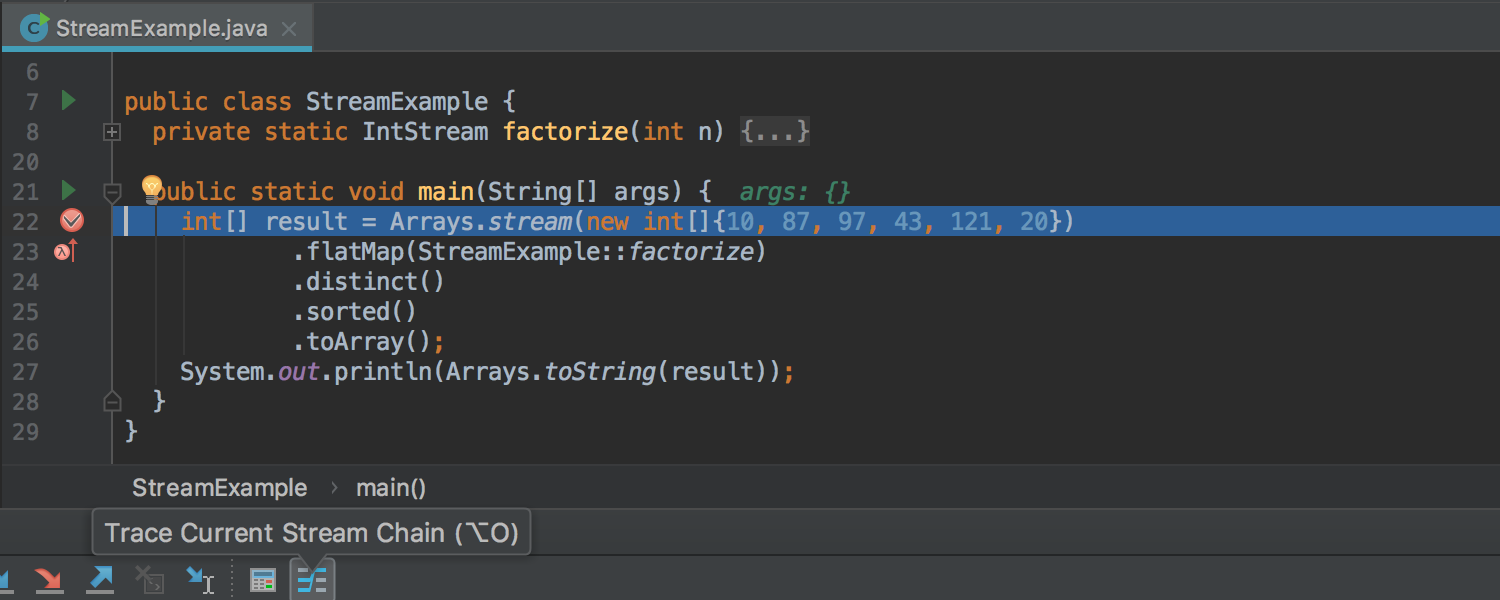
After you click it, the current data stream is evaluated and you get a visualization of what exactly happens to each element from the first call to last, with changes occurring gradually as it's passing thru all the steps:
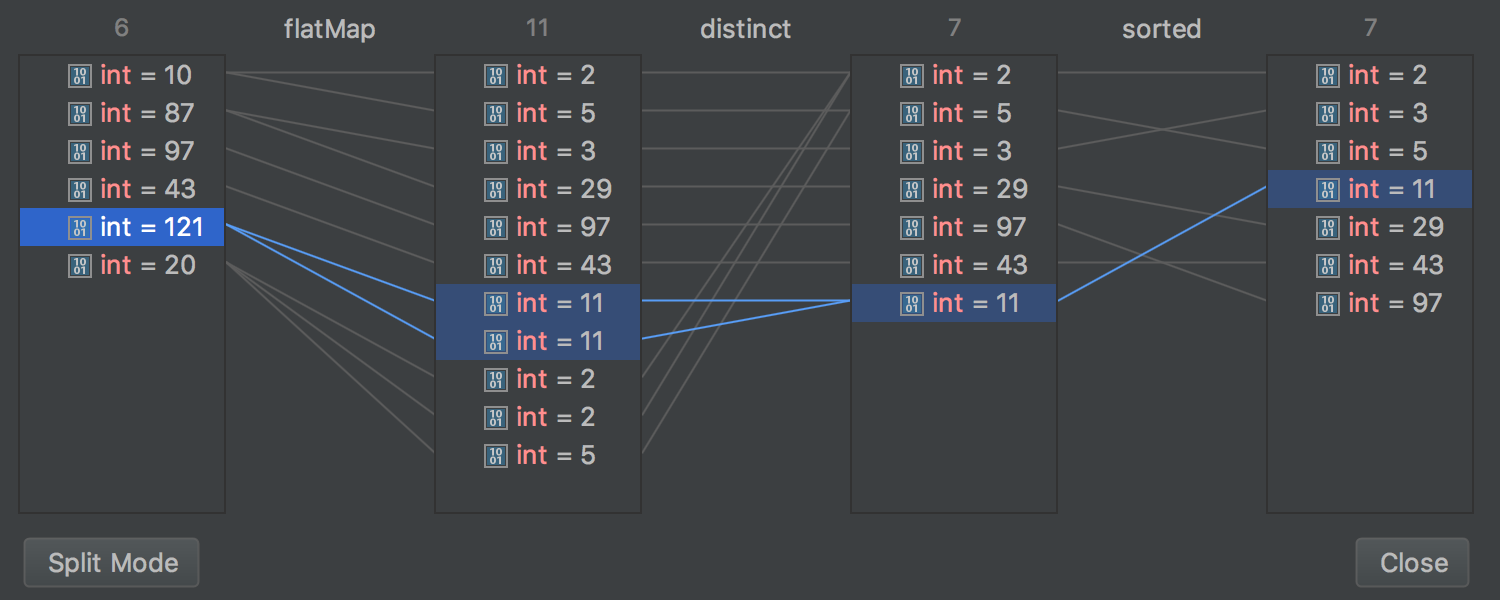
The Split Mode button in the left bottom corner lets you choose whether you want to see all operations at once or separately:
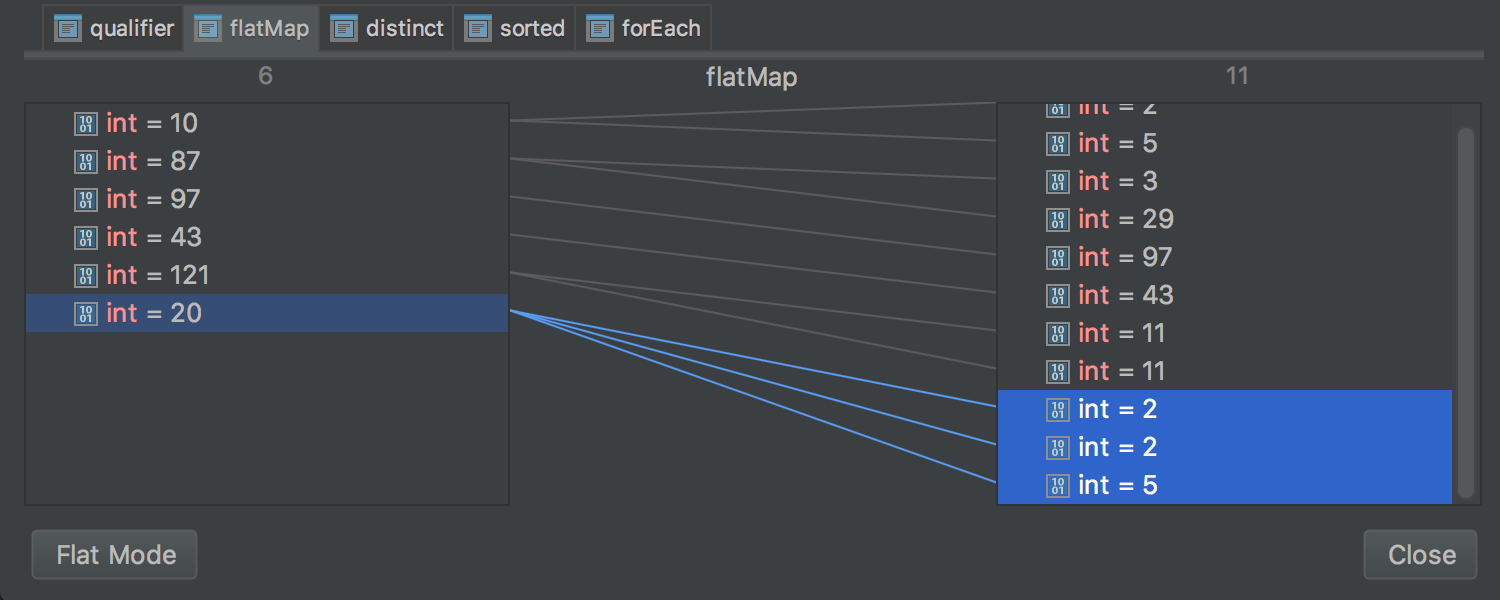
In the latter mode, you can switch between operations manually using the tabs on top.
Watch the following short animation to see these features in action: