(cherry picked from commit 97f75be06b969b46d49a5537afa4a615d7e24cdb)

IJ-CR-166059

GitOrigin-RevId: 134d1d8cabb9395059d1b6fbf3a85ee501364540
stream-debugger-plugin
In some ways, Stream API is better than traditional loop approach: it takes full advantage of modern multi-core architectures, and lets you process data in a declarative way. What's also good is that this approach helps to avoid the state issues, and the code written in it looks more elegant. But, there's a certain downside to it: the code sometimes is sure hard to read, understand, and, of course, to debug.
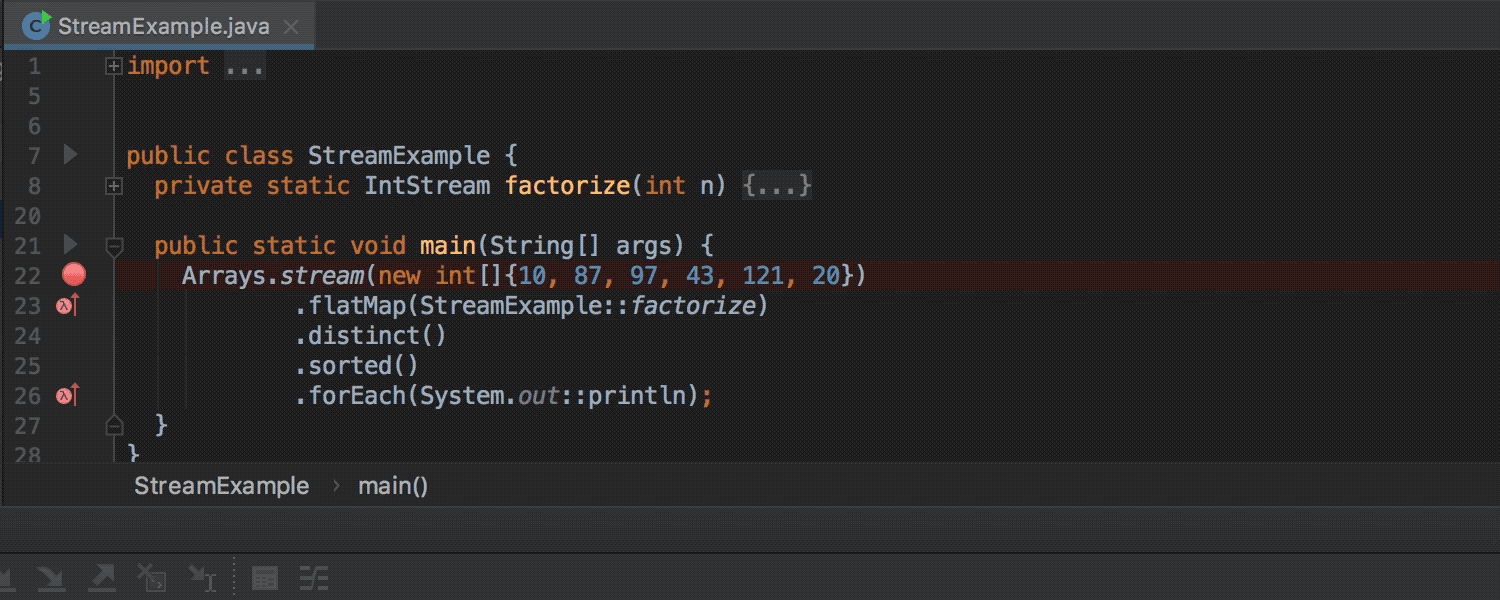
This plugin is here to amend that and offer solutions to the issues you might run into. It extends the Debugger tool window by adding the Trace Current Stream Chain button, which becomes active when debugger stops inside of a chain of Stream API calls.
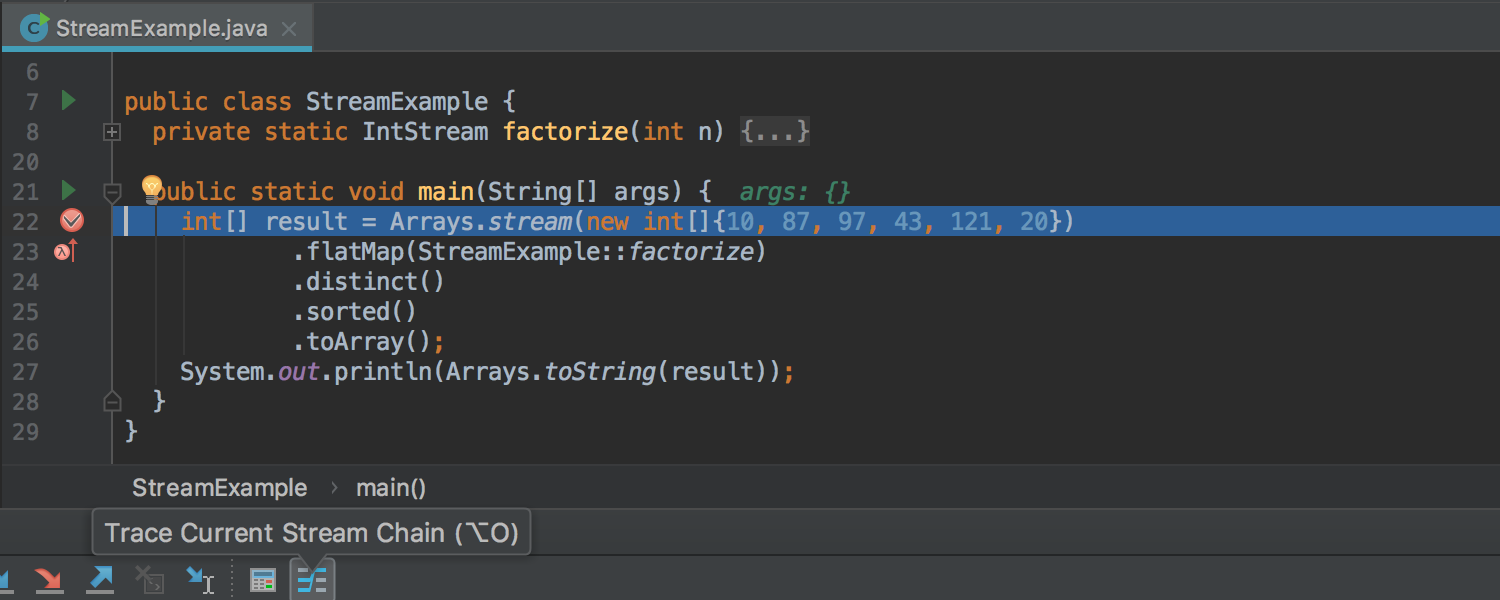
After you click it, the current data stream is evaluated and you get a visualization of what exactly happens to each element from the first call to last, with changes occurring gradually as it's passing thru all the steps:
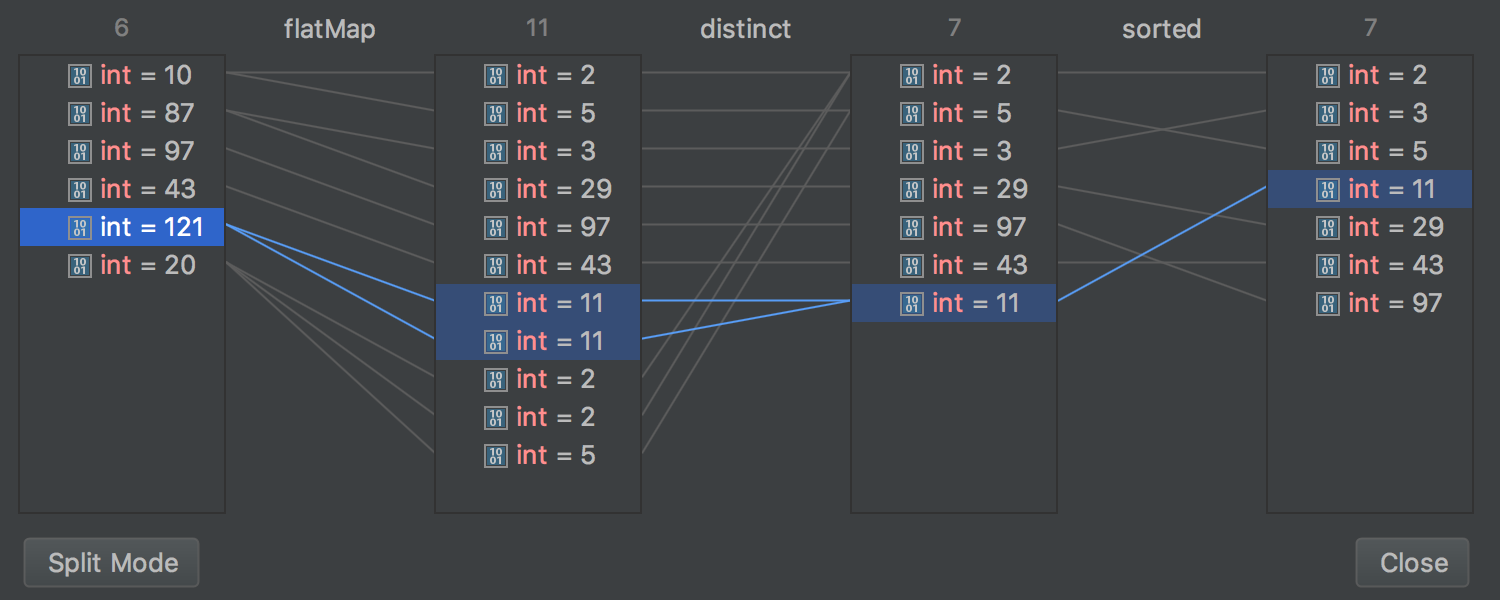
The Split Mode button in the left bottom corner lets you choose whether you want to see all operations at once or separately:
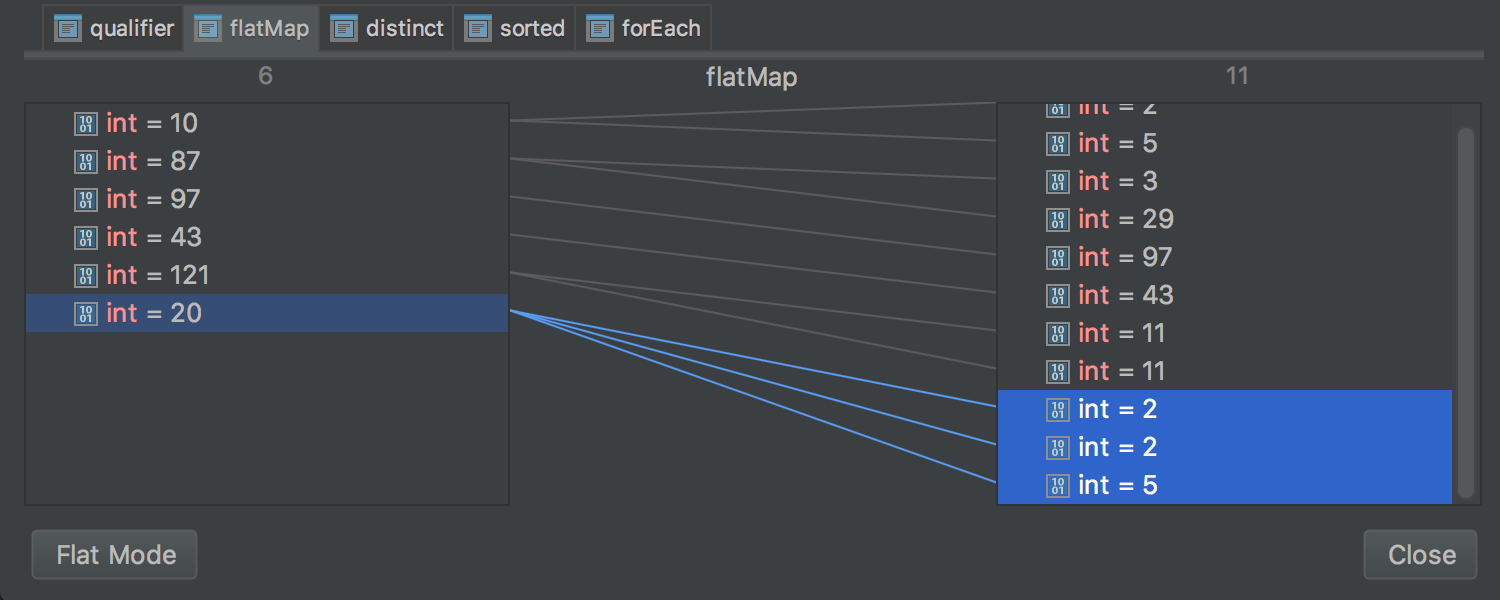
In the latter mode, you can switch between operations manually using the tabs on top.
Watch the following short animation to see these features in action: